7 Graphical Abstracts You Could Make With PowerPoint
Microsoft PowerPoint is one of the most used computer programs among scientists, so it’s probably not far from the truth to say it’s also the most used program for creating graphical abstracts. From the 2007 edition onwards, it comes with a rich array of drawing and design tools that can be easily accessed from the Insert and Format tabs.
Below we’re presenting a selection of graphical abstracts that could have been created with PowerPoint.
We don’t know for sure if they actually were created with this software, but we believe that PowerPoint enables all the necessary functions and tools to achieve the design shown below. Even with PowerPoint, the graphical abstract can be much more than a collage of the result figures.
1. Modulation of Defects in Semiconductors by Facile and Controllable Reduction: The Case of p-type CuCrO2 Nanoparticles
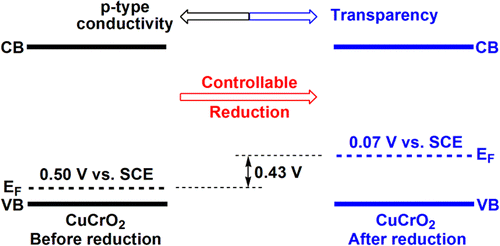
We like this graphical abstract for its simplicity, which is appropriate for the topic of the paper. The abstract is designed as the energy-level diagram and the whole story is told with three colors, one font (Arial) and three shapes – rectangles, arrows and dashed lines. If only little time and simple design tools are available, than an abstraction like this is a good choice.
2. Activation Mechanism of the Bacteroides fragilis Cysteine Peptidase, Fragipain
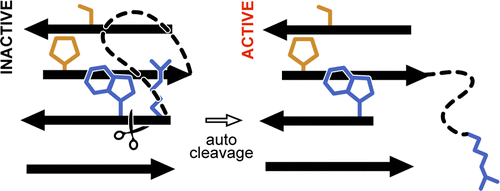
This is a winning abstraction representing an autocleaving enzyme which transforms itself from inactive to active form. Peptide chains are presented with arrows, in line with biochemistry conventions, and colored in black to remain in the background. Important functional groups are emphasized with colors. PowerPoint supports various types of colors and shapes (lines, arrows and polygons) needed for such design. The image of scissors can be obtained from one of the free clipart websites.
3. Probing Ion Transfer across Liquid-Liquid Interfaces by Monitoring Collisions of Single Femtoliter Oil Droplets on Ultramicroelectrodes
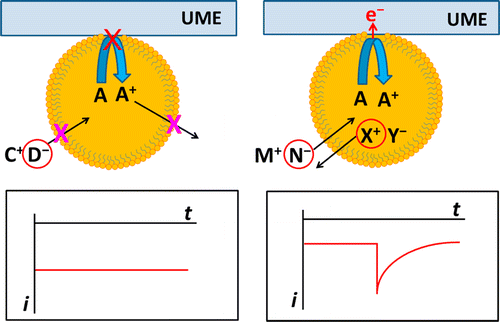
If enough time and effort is devoted into making of a graphical abstract, then even a complex image such as this one can be created with PowerPoint. The software supports all the basic shapes used here – lines, arrows, rectangles and circles. Oil molecules can be drawn from circles and curved lines, then cloned and arranged around the circle’s edge. When a complex structure of the oil droplet is finished, all the components can be grouped and cloned as a whole. We would also like to emphasize another quality of this graphical abstract: the graphs at the bottom were not taken from research figures. Instead, they were drawn particularly for this abstract to ensure the matching style.
4. Influence of Stream Bottom Substrate on Retention and Transport of Vertebrate Environmental DNA
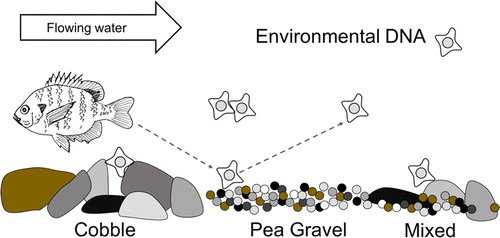
Could the fish, pebbles and environmental DNA in this graphical abstract really be drawn in PowerPoint? The answer is yes – with a skilled hand and lots of patience, of course. The secret is in using the freehand tool, named Scribble, and then editing the curves with the Edit Points tool that is hidden under the Edit Shape button in the Format tab. The Edit Points tool transforms the freehand lines into Bézier curves with handles, not much different from those of Inkscape or Adobe Illustrator. The freehand lines can then be corrected into a nice smooth shape. Components of the desired object can be grouped and cloned as a whole, the same as the environmental DNA in this graphical abstract. We also have to compliment the authors for the good choice of colors.
5. Guanine Crystallization in Aqueous Solutions Enables Control over Crystal Size and Polymorphism
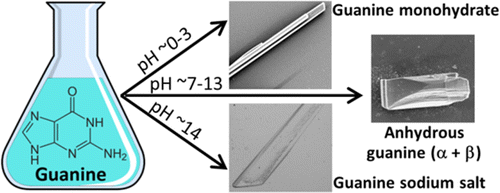
What if you want to combine your research images and drawn objects instead of drawing everything? It is possible, but care must be taken with the choice of colors and styles. The graphical abstract here does it well. The design of the erlenmayer flask is simple and the guanine molecule is colored gray to match the crystals on the right. The pictures of crystals are sized and arranged wisely to make good use of the available space. Images are connected with well-aligned arrows to avoid confusion. Unified font is used.
The image of the flask can can be obtained from one of the free clipart websites. Your pictures can be cropped and resized in PowerPoint and all the elements can be properly arranged with the help of PowerPoint’s gridlines, visual guides (in the View tab) and aligning tools (under the Arrange button in the Home tab).
6. Occurence of Atrazine and Related Compounds in Sediments of Upper Great Lakes
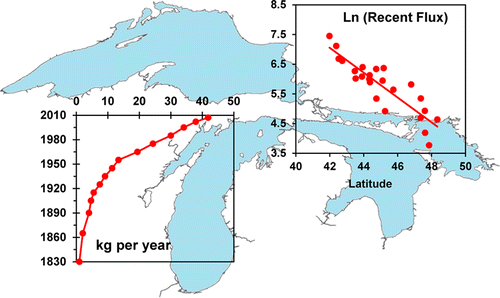
This graphical abstract combines a characteristic image of the Great Lakes with two research graphs. What is not often seen elsewhere is that the graphs are made transparent, so that the image beneath them is fully visible. This is a good solution for constrained space. However, the lines and data points in the graphs have to be wide enough to draw attention, which is easily adjusted in Excel and then transferred to PowerPoint. A limited array of colors ensures that the abstract does not look too busy.
7. Air-Seawater Exchange of Organochlorine Pesticides in the Southern Ocean between Australia and Antarctica
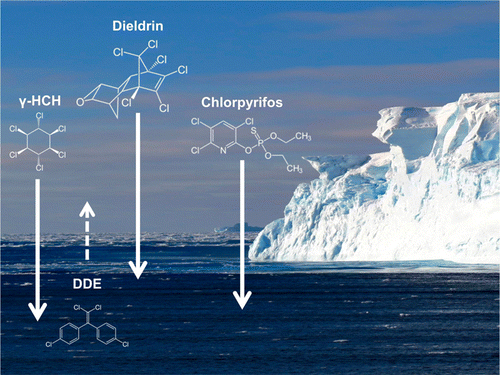
Finally, here is an example of a graphical abstract that is essentially a photograph. With some additions available in PowerPoint, such as text and arrows, it tells the whole story. The molecular structures can be created with ChemDraw, but many of them are also available from the open-source websites such as Wikipedia.
Some Final Tips
To use the PowerPoint’s potential to the fullest, check also:
- our general guidelines on creating graphical abstracts,
- the PowerPoint Image Bank, where you can find free clipart to include in your graphical abstracts when using PowerPoint.
Good luck!
[social_warfare]

Tea Romih (PhD in Nanotoxicology, 2016) is the Seyens.com editor and advisor at Seyens Education Institute, responsible for communication between researchers and illustrators.

Aftab Ansari
September 19, 2018 (10:40 am)
Informative, descriptive and concise. Plain and non-boring!. Excellently elaborated! Thank you very much. Much helpful.