Scientific Graphical Abstracts – Everything You Should Know
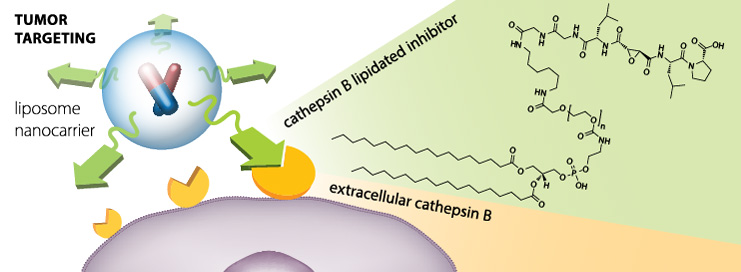
Image source: Angewandte Chemie International Edition (http://onlinelibrary.wiley.com/doi/10.1002/anie.201406845/abstract)
Although graphical abstracts have been around for decades in chemical journals, the concept is quite new in several other fields such as medicine, life sciences, and engineering. The GAs are an excellent method for communicating your research and every (young) researcher should learn how to make them most effectively. This page is meant as a ‘first-and-only’ stop for most information you require to prepare effective graphical abstracts for your journal papers.
What is a graphical abstract?
A graphical abstract is a visual element that clearly and succinctly conveys the main message of your research (paper). One could argue that a graphical abstract should be self-explanatory, however, in Seyens, we believe, that the graphical abstract should be prepared so it works together with the title of your publication. This is because in most cases, the title and the graphical abstract are presented together.
As the scientific messages are usually quite complex, it is crucial to understand how scientists read research papers, where one of the most important lessons is that most scientists don’t read everything, but they read the title and the graphical abstract.
There are several places where your paper’s graphical abstract will be displayed:
- on the first page of your PDF, together with the title and abstract/summary,
- publisher’s online search result lists,
- online TOCs and your paper’s landing page on the journal website (example),
- in the search results (e.g. ScienceDirect), together with the paper’s title and list of authors.
Therefore, your peers will see the abstract of your paper even though the journal paper is behind a paywall. And if it helps your peer researchers decide that the paper’s content is valuable for them, they will more likely read the whole paper and cite it.
What are the goals of a graphical abstract?
According to Elsevier, graphical abstracts should:
- capture the content of the paper at a single glance,
- allow readers to quickly understand the take-home message,
- encourage browsing,
- promote interdisciplinary scholarship,
- help readers identify more quickly which papers are relevant to their research interests.
The criteria for designing graphical abstracts differ from publisher to publisher and are described in the journal’s Guide for Authors. Although they are primarily required for journal papers, they can also be very effectively used in conference posters, slide presentations, or in your project proposal. There are several differences between all these, and we will go over them in the future posts on this website.
Other posts about graphical abstracts
For more about the graphical abstracts, read:
[social_warfare]

Tea Romih (PhD in Nanotoxicology, 2016) is the Seyens.com editor and advisor at Seyens Education Institute, responsible for communication between researchers and illustrators.
Nafiseh
August 8, 2020 (9:53 am)
hello
I need a graphic abstract for my article but I can’t get it. Is it possible for you to prepare it for me?